

Apache::VMonitor - The Visual System and Apache Server Monitor
Stas Bekman is a coauthor of O’Reilly’s upcoming Practical mod_perl.
It’s important to be able to monitor your production system’s health. You want to monitor the memory and file system utilization, the system load, how much memory the processes use, whether you are running out of swap space, and so on. All these tasks are feasible when one has an interactive (telnet/ssh/other) access to the box the Web server is running on, but it’s quite a mess since different Unix tools report about different parts of the system. All of this means that you cannot watch the whole system at the one time; it requires lots of typing since one has to switch from one utility to another, unless many connections are open and then each terminal is dedicated to report about something specific.
But if you are running mod_perl enabled Apache server, then you are in good company, since it allows you to run a special module called Apache::VMonitor thatprovides most of the desired reports at once.
Apache::VMonitor
The Apache::VMonitor module provides even better monitoring functionality than top(1). It gives all the relevant information top(1) does, plus all the Apache specific information provided by Apache’s mod_status module, such as request processing time, last request’s URI, number of requests served by each child, etc. In addition, it emulates the reporting functions of the top(1), mount(1), df(1) utilities. There is a special mode for mod_perl processes. It has visual alerting capabilities and a configurable automatic refresh mode. It provides a Web interface, which can be used to show or hide all sections dynamically.
The module provides two main viewing modes:
- Multi-processes and system overall status reporting mode
- A single process extensive reporting system
Prerequisites and Configuration
You need to have Apache::Scoreboard installed and configured in httpd.conf, which in turn requires mod_status to be installed. You also have to enable the extended status for mod_status, for this module to work properly. In httpd.conf add:
ExtendedStatus On
You also need Time::HiRes and GTop to be installed. GTop relies in turn on libgtop library, which is not not available for all platforms.
And, of course, you need a running mod_perl-enabled Apache server.
To enable this module, you should modify a configuration in httpd.conf, if you add the following configuration:
  <Location /system/vmonitor>
    SetHandler perl-script
    PerlHandler Apache::VMonitor
  </Location>
The monitor will be displayed when you request http://localhost/system/vmonitor.
You probably want to protect this location from unwanted visitors. If you always access this location from the same IP address, then you can use a simple host-based authentication:
  <Location /system/vmonitor>
    SetHandler perl-script
    PerlHandler Apache::VMonitor
    order deny, allow
    deny  from all
    allow from 132.123.123.3
  </Location>
Alternatively you may use the Basic or other authentication schemes provided by Apache and various extensions.
You can control the behavior of this module by configuring the following variables in the startup file or inside the <Perl> section.
You should load the module in httpd.conf:
PerlModule Apache::VMonitor
or from the the startup file:
use Apache::VMonitor();
You can alter the monitor reporting behavior by tweaking the following configuration arguments from within the startup file:
  $Apache::VMonitor::Config{BLINKING} = 1;
  $Apache::VMonitor::Config{REFRESH}  = 0;
  $Apache::VMonitor::Config{VERBOSE}  = 0;
You can control what sections are to be displayed when the tool is first accessed via:
  $Apache::VMonitor::Config{SYSTEM}   = 1;
  $Apache::VMonitor::Config{APACHE}   = 1;
  $Apache::VMonitor::Config{PROCS}    = 1;
  $Apache::VMonitor::Config{MOUNT}    = 1;
  $Apache::VMonitor::Config{FS_USAGE} = 1;
You can control the sorting of the mod_perl processes reports. These report can be sorted by one of the following columns: ``pid’’, ``mode’’, ``elapsed’’, ``lastreq’’, ``served’’, ``size’’, ``share’’, ``vsize’’, ``rss’’, ``client’’, ``request’’. For example to sort by process size, try the following setting:
$Apache::VMonitor::Config{SORT_BY} = "size";
As the application provides an option to monitor processes other than mod_perl ones, you may set a regular expression to match the wanted processes. For example, to match the process names, which include httpd_docs, mysql and squid string, the following regular expression is to be used:
$Apache::VMonitor::PROC_REGEX = join "\|", qw(httpd_docs mysql squid);
We will discuss all these configuration options and their influence on the application shortly.
Multi-processes and System Overall Status Reporting Mode
The first mode is the one that is mainly used, since it allows you to monitor almost all important system resources from one location. For your convenience you can turn on and off different sections on the report, to make it possible for reports to fit into one screen.
This mode comes with the following features.
Automatic Refreshing Mode
You can tell the application to refresh the report every few seconds. You can preset this value at the server startup. For example, to set the refresh to 60 seconds you should add the following configuration setting:
$Apache::VMonitor::Config{REFRESH} = 60;
A 0 (zero) value turns automatic refreshing off.
When the server is started you can always adjust the refresh rate using the application user interface.
top(1) Emulation: System Health Report
Just like top(1), it shows current date/time, machine up-time, average load, all the system CPU and memory usage: CPU load, real memory and swap partition usage.
The top(1) section includes a swap space usage visual alert capability. As we know swapping is undesirable on production systems. The system is said to be swapping when it has used all of its RAM and starts to page out unused memory pages to the slow swap partition, which slows down the whole system and may eventually lead to the machine crash.
Therefore, the tool helps to detect abnormal situation by changing the swap report row’s color according to the following rules:
         swap usage               report color
   ---------------------------------------------------------
   5Mb < swap < 10 MB             light red
   20% < swap (swapping is bad!)  red
   70% < swap (almost all used!)  red + blinking (if enabled)
Note that you can turn on the blinking mode with:
$Apache::VMonitor::Config{BLINKING} = 1;
The module doesn’t alert when swap is being used just a little (<5Mb), since it happens most of the time on many Unix systems, even when there is plenty of free RAM.
If you don’t want the system section to be displayed set:
$Apache::VMonitor::Config{SYSTEM} = 0;
The default is to display this section.
top(1) Emulation: Apache/mod_perl Processes Status
Then just like in real top(1) there is a report of the processes, but it shows all the relevant information about mod_perl processes only!
The report includes the status of the process (Starting, Reading, Sending, Waiting, etc.), process’ ID, time since current request was started, last request processing time, size, shared, virtual and resident size. It shows the last client’s IP and Request URI (only 64 chars, as this is the maximum length stored by underlying Apache core library).
This report can be sorted by any column during the application uses, by clicking on the name of the column, or can be preset with the following setting:
$Apache::VMonitor::Config{SORT_BY} = "size";
The valid choices are: ``pid’’, ``mode’’, ``elapsed’’, ``lastreq’’, ``served’’, ``size’’, ``share’’, ``vsize’’, ``rss’’, ``client’’, ``request’’.
The section is concluded with a report about the total memory being used by all mod_perl processes as reported by kernel, plus an extra number, which results from an attempt to approximately calculate the real memory usage when memory sharing is taking place. The calculation is performed by using the following logic:
- For each process, sum up the difference between shared and total memory.
- Now if we add the share size of the process with the maximum shared memory, then we would get all the memory that is actually used by all mod_perl processes apart from the parent process.
Please note that this might be incorrect for your system, so you should use this number on your own risk. We have verified this number on the Linux OS, by taken the number reported by Apache::VMonitor, then stopping mod_perl and looking at the system memory usage. The system memory went down approximately by the number reported by the tool. Again, use this number wisely!
If you don’t want the mod_perl processes section to be displayed set:
$Apache::VMonitor::Config{APACHE} = 0;
The default is to display this section.
top(1) Emulation: Any Processes
This section, just like the mod_perl processes section, displays the information in a top(1) fashion. To enable this section you have to set:
$Apache::VMonitor::Config{PROCS} = 1;
The default is not to display this section.
Now you need to specify which processes are to be monitored. The regular expression that will match the desired processes is required for this section to work. For example, if you want to see all the processes whose name include any of these strings: http, mysql and squid, then the following regular expression would be used:
$Apache::VMonitor::PROC_REGEX = join "\|", qw(httpd mysql squid);
The following snapshot visualizes the sections that have been discussed so far.
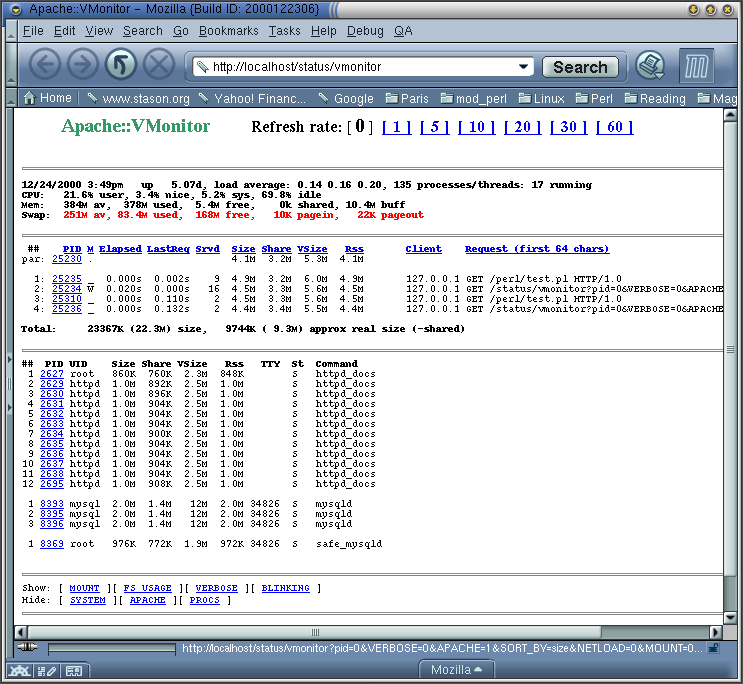 |
| Figure 1.1: Emulation of top(1), Centralized Information About mod_perl and Selected Processes
(Click for larger image) |
As you can see the swap memory is heavily used and therefore the swap memory report is colored in red.
mount(1) Emulation
This section reports about mounted filesystems, the same way as if you have called mount(1) with no parameters.
If you want the mount(1) section to be displayed set:
$Apache::VMonitor::Config{MOUNT} = 1;
The default is NOT to display this section.
df(1) Emulation
This section completely reproduces the df(1) utility. For each mounted filesystem, it reports the number of total and available blocks (for both superuser and user), and usage in percents.
In addition it reports about available and used file inodes in numbers and percents.
This section has a capability of visual alert which is being triggered when either some filesystem becomes more than 90 percent full or there are less than 10 percent of free file inodes left. When this event happens, the filesystem-related report row will be displayed in the bold font and in the red color. A mount point directory will blink if the blinking is turned on. You can turn the blinking on with:
$Apache::VMonitor::Config{BLINKING} = 1;
If you don’t want the df(1) section to be displayed set:
$Apache::VMonitor::Config{FS_USAGE} = 0;
The default is to display this section.
The following snapshot presents an example of the report consisting of the last two sections that were discussed (df(1) and mount(1) emulation), plus the ever important mod_perl processes report.
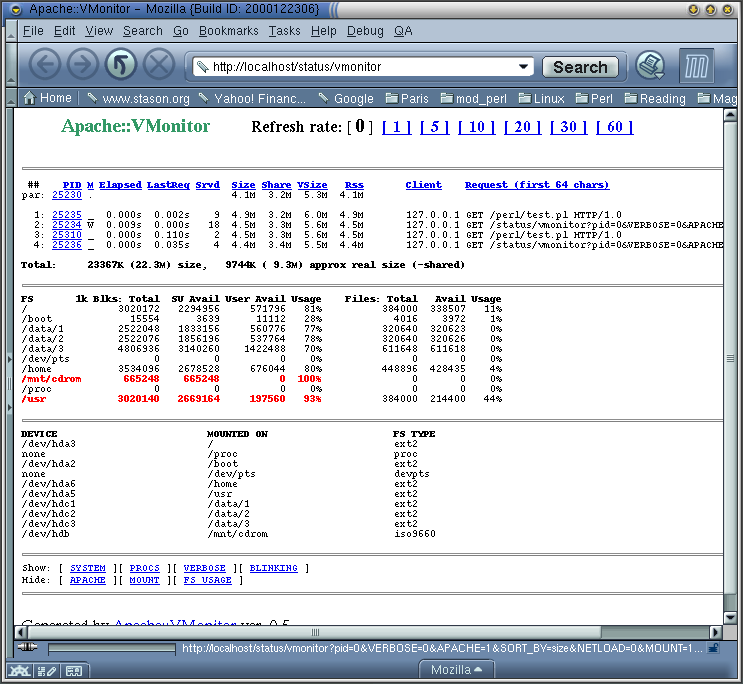 |
| Figure 1.2: Emulation of df(1) both Inodes and Blocks Utilization. Emulation of mount(1).
(Click for larger image) |
You can see that /mnt/cdrom and /usr filesystems are utilized for more than 90 percent and therefore colored in red. (It’s normal for /mnt/cdrom, which is a mounted cdrom, but critical for the /usr filesystem which should be cleaned up or enlarged).
abbreviations and hints
The report uses many abbreviations, which might be knew for you. If you enable the VERBOSE mode with:
$Apache::VMonitor::Config{VERBOSE} = 1;
this section will reveal all the full names of the abbreviations at the bottom of the report.
The default is NOT to display this section.
A Single Process Extensive Reporting System
If you need to get an in-depth information about a single process, then you just need to click on its PID.
If the chosen process is a mod_perl process, then the following info would be displayed:
- Process type (child or parent), status of the process (Starting, Reading, Sending, Waiting, etc.), how long the current request is processed or the last one was processed if the process is inactive at the moment of the report take.
- How many bytes transferred so far. How many requests served per child and per slot.
- CPU times used by process:
total,utime,stime,cutime,cstime.
For all (mod_perl and non-mod_perl) processes the following information is reported:
- General process info: UID, GID, State, TTY, Command line arguments
- Memory Usage: Size, Share, VSize, RSS
- Memory Segments Usage: text, shared lib, date and stack.
- Memory Maps: start-end, offset, device_major:device_minor, inode, perm, library path.
- Loaded libraries sizes.
Just like the multi-process mode, this mode allows you to automatically refresh the page on the desired intervals.
The following snapshots show an example of the report about one mod_perl process:
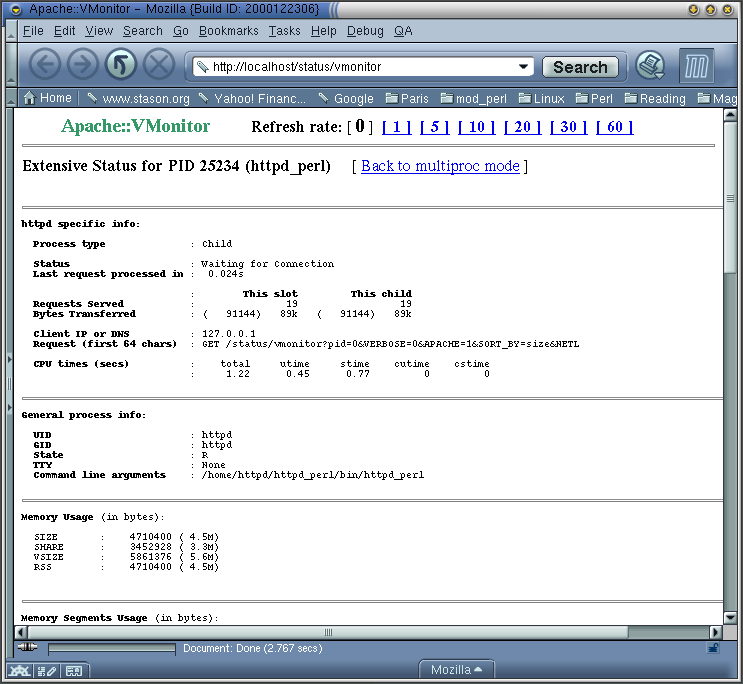 |
| Figure 1.3: Extended information about processes: General Process Information
(Click for larger image) |
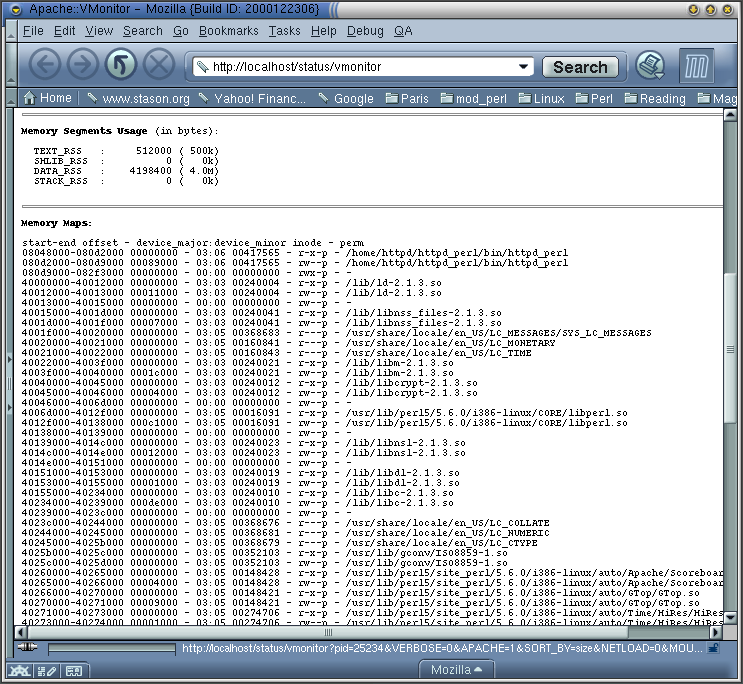 |
| Figure 1.4: Extended information about processes: Memory Maps
(Click for larger image) |
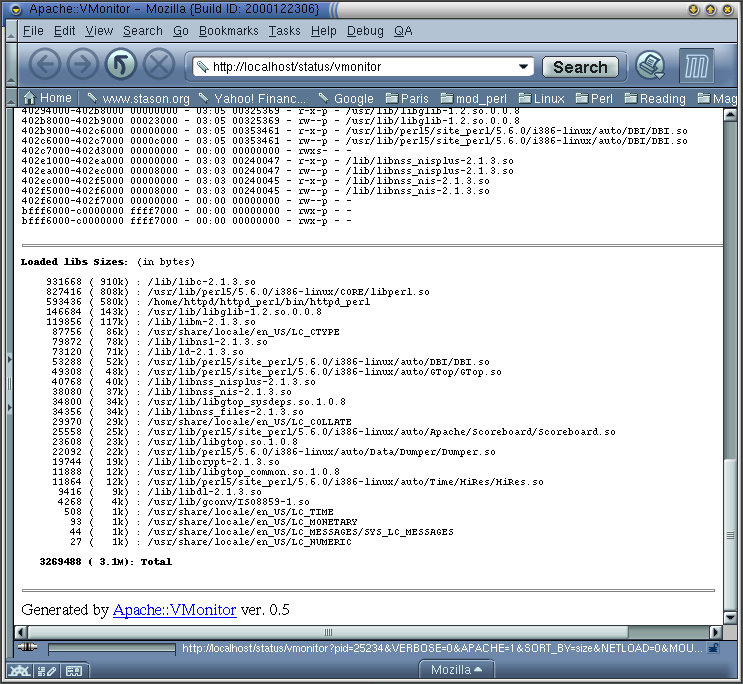 |
| Figure 1.5: Extended information about processes: Loaded Libraries
(Click for larger image) |
References
-
The mod_perl site’s URL:
-
GTop
GToprelies in turn on libgtop library not available for all platforms
Tags
Feedback
Something wrong with this article? Help us out by opening an issue or pull request on GitHub
Site Map
License
This work is licensed under a Creative Commons Attribution-NonCommercial 3.0 Unported License.

Legal
Perl.com and the authors make no representations with respect to the accuracy or completeness of the contents of all work on this website and specifically disclaim all warranties, including without limitation warranties of fitness for a particular purpose. The information published on this website may not be suitable for every situation. All work on this website is provided with the understanding that Perl.com and the authors are not engaged in rendering professional services. Neither Perl.com nor the authors shall be liable for damages arising herefrom.