

Charting Data at the Bottom of the World
I have an odd job: I’m the only programmer for about 500 miles. I look after experiments on a remote Antarctic research station and look after the data they produce. As well as the scientific stuff knocking about, we have between 20 and 70 people, most of them keen on the weather. Either because we can’t work if its windy, or can enjoy a spot of kite skiing if it’s just windy enough, everyone here wants to know what’s going on outside.
Luckily we have a few climate science experiments running, including a weather station. For a few years now, data from the weather station has been available on people’s computers through a Perl Tk application and some slightly baroque shuttling of records between three different data servers and the network the office computers run on. All is well and good, and we leave it well alone, as it’s worked well. Recently, a new experiment installed on the station provides an up-to-the-minute profile of wind speeds over the first 30 meters of the air. It’s there to support research into interactions between snow and air in Antarctica, but it’s also crucial information if you want to head out and whiz about behind a kite.
The data from this mast goes to a remote machine that allows users to VNC in to check its health, and logs this data to a binary format of its own making. People around the station have taken to logging in to this machine before heading out, which is probably not the best way keep the data rolling in without interruption. Rather than forbidding access to this useful source of local data, we decided to upgrade our weather display system to include the major parameters recorded by the mast.
Alas, while fairly nice to use, Tk is a bit fiddly and not exactly my cup of tea. Adding new displays to an existing application can be time-consuming, as you must re-learn the relations among each different widget, pane, and button. Added to this programming burden, even if we could find every copy of the application scattered around our network, we’d have to do so every time we added some other source of data. We settled instead on a complete rewrite as a CGI script and some automatically generated graphs. A fancier man than me might call that a three-tier application, but then, he’d probably be selling you something at the same time.
Mountains of Data
Before you can see what the weather is doing (beyond looking out of the window), you need to get at the raw numbers somehow. Ours are provided by state-of-the-art scientific instruments in state-of-the-art data formats; that is to say, partly as lines of ASCII data in columns, and partly as fixed-length records in a binary file. No matter, though. Perl and some friends from CPAN make fast work of building meaning from tumbled piles of data.
Before doing anything, I set up a couple of objects to hold some data values. Each set of observations has a class corresponding to the experiment that generated it. The classes also contain read_file factory methods that read a file and produce a list of observations. To make things as quick (to write) as possible, I used Class::Accessor to autogenerate get and set methods for my objects:
 # Current weather data
 package Z::Weather;
 use base qw(Class::Accessor);
 Z::Weather->mk_accessors( qw(time temp pressure wind dir) );
This automatically creates a new() method for Z::Weather. Call it as:
 my $weather = Z::Weather->new({time => $time,
                                temp => $temp,
                                pressure => $pres,
                                wind => $wind,
                                dir
It also generates get and set accessors for each field:
 # set
 $weather->temp(30);

 # get
 my $temp = $weather->temp();
(The “codename” used when shipping items to our station is Z, so I’ve used that as my little local namespace, too.)
From our mast, we have a number of observations taken at different heights, so I wanted a slightly more complicated representation, using a class to represent the mast and another to represent each level on the mast.
 package Z::Mast;
 use base qw(Class::Accessor);

 Z::Mast->mk_accessors(qw(time values));

 package Z::Mast::Level;
 use base qw(Class::Accessor);
 Z::Mast::Level->mk_accessors(qw(wind dir level));
Remember that Z::Mast::values will set and get a reference to an array of ::Level objects. If I wanted to enforce that, I could override the methods provided by Class::Accessor, but that would create work that I can get away without doing for this simple case.
Now that I know what the data will look like in Perl, I can wrench it from the covetous hands of our data loggers and turn it into something I can use.
First, I decided to deal with the plain ASCII file. This contains single lines, with the time of observation first, then white-space-separated values for temperature, pressure, wind speed, direction, and a few others that I don’t care about. Z::Weather needs to use a couple of modules and add a couple of methods:
 use IO::All;

 sub from_file {
     my $class = shift;
     my $io    = io(shift);
     my @recs  = ();

     while (my $line = $io->readline()) {
         chomp($line);
         push @recs, $class->_line($line);
     }
     return @recs;
 }
I expect to call this as:
my @weather_records = Z::Weather->fromfile("weather.data");
Using the IO::All module to access the files both makes it very easy to read the file and also allows calling code to instead supply an IO::All object of its own, or to call this method with a filehandle already opened to the data source. This will make it easy to obtain data from some other source; for instance, if the experiment changes to provide a socket from which to read the current values.
Parsing the data is the responsibility of another method, _line(), which expects lines like:
 2006 02 06 01 25  -10.4  983.2  23.5 260.1

 use DateTime;
 sub _line {
     my ($class, $line) = @_;
     my @vals = split /\s+/, $line;

     # extract time fields and turn into DateTime object
     my($y, $m, $d, $h, $min)
        = $line =~ /^(\d{4}) (\d\d) (\d\d) (\d\d) (\d\d)/;

     my $t = DateTime->new(year=>$y,month=>$m,day=>$d,hour=>$h,minute=>$min);

     # return a new Z::Weather record, using the magic new() method
     return $class->new({time => $t,
                         temp     => $vals[5],
                         pressure => $vals[6],
                         wind     => $vals[7],
                         dir      => $vals[8],  });
 }
split and Perl’s magic make sense of the data points, and the DateTime module take cares of the details of when the record was produced. I find it much easier to turn any time-related value into a DateTime object at the soonest possible moment, so that the rest of my code can expect DateTime objects. It becomes easier to reuse in other projects. If you find yourself writing code to handle leap years every other day, then make using DateTime your number one new habit.
I deal with the mast data in a similar way, except that the other format is fixed-length binary records. The time of the recording is stored in the first four bytes as the number of seconds into an arbitrary epoch. I correct this into Unix time when creating its DateTime object. Values are stored as two-byte, network-endian unsigned shorts stored as hundredths of the recorded values. unpack() comes to my aid here.
 sub from_file {
   my $class = shift;
   my $io    = io(shift);
   my ($rec, @recs);

   while ($io->read($rec, 62) == 62) {
     push @recs, $class->_record($rec);
   }
   return @recs;
 }

 # map height of reading to offsets in binary record
 our %heights = qw(1 24  2 28 4 32  8 36  15 40  30 44);
 use constant MAST_EPOCH => 2082844800;

 sub _record {
   my ($class, $rec) = @_;

   # extract the time as a 4 byte network order integer, and correct epoch
   my $crazy_time = unpack("N", $rec);
   my $time       = DateTime->from_epoch(epoch=>$crazy_time-MAST_EPOCH);

   # then a series of (speed, dir) 2 byte pairs further into the record
   my @vals;
   foreach my $offset (sort values %heights) {
     my ($speed, $dir) = unpack("nn", substr($rec, $offset));
     push @vals,
       Z::Mast::Level->new({wind=>$speed*100,
                            dir => $dir*100,
                            level=>$heights{$offset}});
   }
   return $class->new({time => $time,
                       values => \@vals});
 }
Again, I can call this using any one of the types supported by IO::All. Again, I wield DateTime to my advantage to turn a time stored in an unusual epoch quickly into an object which anything or anyone else can understand. There are a few magic numbers here, but that’s what you end up with when you deal with other people’s crazy file formats. The key thing is to record magic numbers in one place, to allow other people to change them if they need to, both in your code and from their own code (hence the our variable), and finally, to let values pass from undocumented darkness into visible, named objects as soon as possible.
Displaying Data
I now have hold of the weather data and have forced it into a form that I can follow. Now I get to show it to someone else. I did this in two different ways: as raw data through a web page and as a pre-generated chart embedded in the page.
In each case, the code has to read in files to obtain the necessary data:
my @weather_records = Z::Weather->from_file('weather.data.dat');
Then it needs to produce the web page:
 use Template;
 my $template = Template->new();

 print "Content-type: text/html\n\n";

 $template->process(\*DATA, {
                       now => $weather_records[-1],
                       records => \@weather_records,
                             })
    || die "Could not process template: ".$template->error()."\n";
This isn’t really all that interesting. In fact, it looks almost like this does nothing at all. I’ve pulled in the Template module, told it to build and output a template defined after the __END__ of the script, and given it two template variables to play with. The template looks something like:
__END__
<html><head><title>Weather</title></head>
<body>
<h2>Latest weather data at [% now.time %]<a name="/h2">
<P>T: [% now.temp %] °C
P: [% now.pressure %] kPa
W: [% now.wind %] kts
D: [% now.dir %] °</p>
<P><img src="/weather_chart.png"><br>
<img src="/mast_chart.png"</p>
<table>
<tr><th> Time </th><th> Temp </th><th> Wind </th></tr>
[% FOREACH rec IN records %]
<tr>
<td>[% rec.time %]</td>
<td>[% rec.temp %]</td>
<td>[% rec.wind %]</td>
</tr>
[% END %]
</table>
</body></html>
The template uses the syntax of the Template-Toolkit, a general-purpose templating framework. It’s useful because it allows the separation of display and formatting of data from the code that generates it. There’s no Perl code in the template, and no HTML will appear in any of my Perl code. While the output generated now is ugly and basic, it will be easy to make it flashy later, once I have the program working, without having to change anything in the program itself to do so. As I’ve prepared our data carefully as objects with sensible methods, I can just hand a bunch of these over to the template and let it suck out whatever it wants to show.
Pretty Pictures
Producing the charts is, again, a simple business (by now, the theme of this article should be emerging). Gone are the days when you’d have to scratch your head figuring out how to draw lines and plot points; gone even are the days when you have to bang your head hard against the confused API of some long-forgotten module. Taking the mast values as an example, I first need to read in the data:
my @mast_values = Z::Mast->from_file('mast.data.dat');
Because old weather is old news, I throw away any values older than three hours, using DateTime and DateTime::Duration methods in a grep:
 use DateTime;
 use DateTime::Duration;

 my $now = DateTime->now();
 my $age = DateTime::Duration->new(hours => 3);

 @mast_values = grep { $_->time + $age > $now } @mast_values;
This is so, so much easier than fiddling around with epochs and 3*3600 all over the place. If you find yourself writing 3600 anywhere in your code, you should be using DateTime::Duration instead. Next, I feed the data points into the Chart::Lines module, a part of the Chart distribution. I use this in three phases. First, I create a new Chart and specify how large the resulting graphic should be:
 use Chart::Lines;
 my $chart = Chart::Lines->new($x_size, $y_size);
Then I set up a few options to tweak how the chart will display:
 $chart->set(
    legend          => 'none',
    xy_plot         => 'true',
    grey_background => 0,
    y_label         => 'Wind kts',
    x_label         => 'Hours ago',
    colors          => {
      y_label    => [0xff, 0xee, 0xee],
      text       => [0xff,0xee,0xff],
      dataset0   => [0xff,0,0],
      dataset1   => [0,0xff,0xff],
      dataset2   => [0,0,0xff],
      background => [0x55, 0x00, 0x55],
                },
    );
These are mostly self-explanatory; the Chart documentation covers them in detail. I set xy_plot to true so that the module will use the first dataset as the x values and all of the other datasets as the y values for a line. I set a bunch of rather bright colors, to keep my avid customers cheerful, and set the text used to label the chart.
my @labels = map {($now->epoch - $_->time->epoch) / 60} @mast_values;
Finally, I used a series of map expressions to extract x and y values from the data. One turns the DateTime times into a number of minutes ago. These values are the x values. y values are the appropriate parameters extracted from the nested Z::Mast and Z::Mast::Label objects. The rest of the code provides the data to the plotting method of the chart, directing it to write out a .png file (Figure 1).
 $chart->png("mast.png",
               [ \@labels,
                [map {$_->values()->[0]->wind} @mast_values],
                [map {$_->values()->[1]->wind} @mast_values],
                [map {$_->values()->[2]->wind} @mast_values],
                  ]);
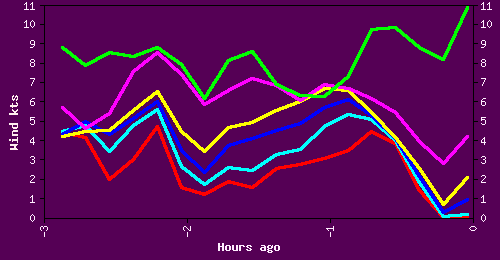 *Figure 1. The resulting chart*
All I need now is a working HTTP server and a crontab entry or two to run the graphic generation programs. It is possible to use the Chart modules to generate CGI output directly using the Chart::cgi method, but I found that this was too slow once lots of different clients accessed the weather data at the same time. It was a simple task to instead switch to a crontab-based approach for the graphs, with a CGI script still providing real-time access to the current values.
Conclusions
The Chart family of modules provides more than just an x-y plot. Pie, bar, Pareto, and mountain charts, amongst others, are available through the same API as I discussed in this article. They are just as easy to whip into being to satisfy even the most demanding of data consumers.
The Template Toolkit is used mainly for more complicated websites and content management systems, but it will simplify the production of simple sites and pages, allowing you to concentrate on the detail of the problem by separating data and its presentation. Even though a problem is simple and allows a fast solution, you can reach your goal faster still by pulling in big tools to do little jobs.
As for the DateTime module, I simply wouldn’t go anywhere without it. These days, I find myself automatically typing use DateTime; along with warnings and strict at the head of every Perl program I write.
Class::Accessors makes the creation of data representation objects faster than typing in a C struct, provides some level of documentation about what the data you’re dealing with, and allows for reuse. You could just stick everything into layers of nested hashes and arrays, but this is a certain path to eventual confusion. Class::Accessors will keep you sane and save your fingers at the same time.
IO::All should be a part of your day-to-day toolkit; the new idioms it provides will soon see you using it everywhere, even in one-liners.
One of the many joys of programming lies in the satisfaction we receive when we make someone’s life that little bit better. Perl makes it easy, fast, and fun for us to tread that path. Perl’s greatest strength, the rock upon which its greatness is founded, is the speed with which we can take a problem, or a cool idea, and structure our half-formed thoughts into a soundly built solution.
Download the example code for this article.
Tags
Feedback
Something wrong with this article? Help us out by opening an issue or pull request on GitHub

